2. 航天材料及工艺研究所, 先进功能复合材料技术重点实验室, 北京 100076
2. Science and Technology on Advanced Functional Composites Laboratory, Aerospace Research Institute of Materials & Processing Technology, Beijing 100076
纳米压痕技术作为一种优异的测试材料微小区域力学性能的方法,已广泛用于玻璃碳、石墨及富勒烯膜的性能表征[1-4]。国内外学者已采用纳米/微米压痕方法对复合材料中的增强相碳纤维的性能开展了研究[5-9]。对于T800级碳纤维的研究主要集中在微观结构及微观结构与性能相关性等方面[10-17],关于T800级碳纤维弹性模量和硬度的研究却鲜见报道。本文采用纳米压痕技术系统研究了纤维不同取向(纤维轴向与纳米压痕测试面成θ夹角,0°≤θ≤90°)的弹性模量和硬度。采用两参数Weibull分布函数对T800SC碳纤维的弹性模量和硬度进行统计分析,获得了T800SC碳纤维的特征弹性模量、硬度及Weibull模数,以期为C/E复合材料构件、部件的结构设计、分析、可靠性评价提供详尽的性能数据。
1 实验 1.1 试样准备T800SC碳纤维:直径5.3 μm,密度1.81 g/cm3,拉伸强度5.88 GPa,模量294 GPa,断裂伸长率1.9%。经环氧树脂浸渍后连续通过自制挤压模具,经加热固化后脱去模具获得直径2 mm的碳纤维棒,将该棒固定在直径10 mm的铝质圆管中,并在圆管内灌装环氧树脂(以芳香胺为固化剂),常温固化24 h。将镶嵌有碳纤维棒的铝质圆管进行机械切割。切割时,刀具与质圆管轴线的夹角从0°~90°变化,每隔10°切割一个试样,以获得纤维不同取向的试样。具体制备流程如图 1所示。

|
| 图 1 碳纤维不同取向试样的制备流程 Figure 1 Schematic diagram for preparing carbon fiber samples with different orientations |
采用自动金相镶样机将切割后的试样镶嵌在树脂中,制成尺寸为Φ30 mm×35 mm的圆柱试样。将镶嵌后的试样置于自动抛磨机上,顺序用400#、800#、2000#金相砂纸研磨,随后用0.5、0.25、0.05 μm的氧化铝粉进行抛光处理。
1.2 实验方法采用ZEISS Imager. M2m型光学显微镜对纤维不同取向的试样进行观察,采用Image J软件对纤维截面面积进行计算。
采用美国Aglient公司的G200型纳米压痕仪对碳纤维进行纳米压痕测试。选用Berkovich三棱锥压头,载荷系统分辨率为50 nN,位移分辨率为0.01 nm。测试时采用连续刚度测试方法(CSM),在加载过程中连续计算试样的接触刚度,利用Oliver-Pharr模型获得试样弹性模量随测试位移的变化[18]。CSM法测试时应变速率为0.5/s,谐波位移和频率分别为2 nm和45 Hz,碳纤维的泊松比假设为0.30。通过纳米压痕测试获得p-h曲线、最大载荷pmax下的压痕位移hmax、卸载后由于弹性回复而残留的压痕位移hmax,借助Oliver-Pharr模型计算得到材料的弹性模量、硬度。纳米压痕测试时各测量参数示意图如图 2所示。

|
| 图 2 纳米压痕载荷-位移曲线 Figure 2 Load-displacement curve of nanoindentation |
测试时将金相试样固定在样品台上,通过光学显微镜观察试样表面情况并进行定位,压痕位移设定为600 nm。对于同一试样,在试样上随机选取45个测试点。
采用两参数Weibull分布函数对纳米压痕测试结果进行统计分析。两参数Weibull分布函数可用下式表示:
| $ p = 1 + {\left( {\frac{x}{{{x_0}}}} \right)^m} $ | (1) |
式中, p为失效概率;x为试样实测性能;x0为尺度参数;m为Weibull分布模数,其值越高,含缺陷越少,强度分散性越小,性能越稳定。
将测试结果按升序排列,试样在xi时发生失效的概率为
| $ p = (i-0.5)/N $ | (2) |
则得到N个(pi,xi)数对,将式(1) 取两次对数变换为
| $ \ln \left( {\ln \frac{1}{{1-p}}} \right) = m\left( {\ln x-\ln {x_0}} \right) $ | (3) |
用最小二乘法对N个(pi,xi)数对按式(3) 进行拟合处理,可获得Weibull分布模数m值。
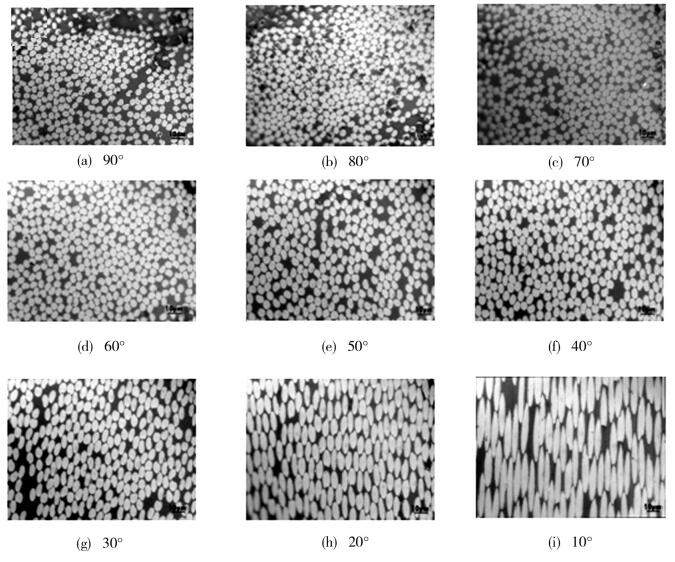
2 结果与讨论 2.1 不同取向碳纤维的光学图像图 3为碳纤维不同取向的截面光学图像。从每张图像中随机选取15根纤维,计算其截面面积,通过对比纤维不同取向的理论截面面积与实际测量截面面积,考查试样制备时纤维取向角是否准确。图 3(a)随机选取的15根纤维的平均直径为(5.4±0.2) μm,与生产商的标称直径(5.3 μm)正偏差2.21%。从图 3中可以看出,当纤维与其轴向夹角从90°减小至40°时,纤维截面面积的变化较小,纤维截面基本为圆形;当纤维与其轴向取向角从30°减小至10°时,纤维截面面积明显增大,纤维截面也从圆形逐渐转变为椭圆形。采用Image J软件,在每张图片中随机选取15根纤维,对其截面面积进行统计,其结果如表 1所示。纤维不同取向时获得的纤维截面面积与理论面积非常接近,最大标准偏差在10%以内,可认为制备的纤维不同取向金相试样满足实验设计要求,能够用于后续纳米压痕测试。

|
| 图 3 T800SC碳纤维不同取向试样的光学图像 Figure 3 Optical light images of T800SC carbon fiber with different orientations |
| 取向角 /(°) |
理论面积 /μm2 |
实际面积 /μm2 |
偏差 /% |
| 90 | 22.06 | 23.07±1.59 | 4.59 |
| 80 | 22.40 | 23.26±1.34 | 3.84 |
| 70 | 23.48 | 25.80±1.75 | 9.89 |
| 60 | 25.47 | 27.95±1.57 | 9.72 |
| 50 | 28.80 | 31.63±1.98 | 9.84 |
| 40 | 34.32 | 37.67±1.56 | 9.76 |
| 30 | 44.12 | 45.13±2.89 | 2.28 |
| 20 | 64.50 | 69.50±3.43 | 7.75 |
| 10 | 127.05 | 132.47±5.75 | 4.26 |
图 4为碳纤维不同取向时的纳米压痕载荷-位移曲线。碳纤维作为一种典型的脆性材料,在加载过程中,试样表面发生弹塑性变形,随着载荷的增加,位移逐渐增大。卸载过程主要是弹性变形的回复过程。

|
| 图 4 T800SC碳纤维纳米压痕的载荷-位移曲线 Figure 4 Nanoindentation load-displacement curves of T800SC carbon fiber |
对于不同取向的碳纤维,其载荷-位移曲线存在如下差异:(1) 最大压痕位移hmax对应的最大载荷pmax不同,表明不同取向的碳纤维对载荷有不同的响应机制;(2) 卸载段曲线的斜率不同,说明不同取向上碳纤维的弹性模量不同。
T800SC为PAN基碳纤维,主要由<5 nm的石墨微晶组成[19-21]。沿垂直纤维轴向方向,石墨微晶结合较弱,其微观结构趋于各向同性;沿纤维轴向方向,石墨微晶择优取向,结合较强。T800SC碳纤维微观结构可用图 5(a)表示[22-24]。PAN基碳纤维中石墨微晶的无序结构与有序结构相间排列并相互缠结,微晶相互连接沿纵向形成带状结构。

|
| 图 5 PAN基碳纤维的结构示意图及纳米压头作用下碳纤维的变形示意图 Figure 5 Schematic microstructure of PAN-based carbon fiber and deformation of carbon fiber under compressive load of nanoindentation |
图 5(b)、(c)和(d)为碳纤维不同取向时测试面与纳米压头的相对关系。图 5(d)中,T800SC碳纤维的受力面与纤维轴向成θ夹角(0° < θ < 90°),在这种情况下,碳纤维受力面所受的纳米压头载荷可以分解为平行和垂直于纤维轴向的两个方向的载荷[25-27]。
从图 5(e)可看出,碳纤维横截面受压缩载荷时,纤维内将产生两种模式的变形[28]:石墨微晶中石墨烯片层的剪切和折裂。折裂主要发生在微晶内部及石墨微晶的边界处。在折裂过程中,石墨烯片层内的共价键仍然保持完整。若无共价键的断裂,则由石墨烯片层的折裂造成的变形是完全弹性的。而石墨烯片层的剪切与石墨烯片层间Van der Waals键的断裂有关。因为键的断裂是不可逆的,由剪切造成的变形在本质上是塑性的,具体变形过程如图 5(f)所示,这种情形下,需施加较大的压缩载荷才能在碳纤维的石墨微晶边界处产生折裂变形。
从图 5(g)可看出,压缩行为体现为纤维横向受拉伸长,且碳纤维的这种变形行为可能因孔隙的作用而增强。同时,石墨烯片层之间结合力较弱,在纳米压头压缩载荷作用下,石墨烯片层之间趋于彼此分离(楔形效应)。这种情况下,较小的压缩载荷即可在碳纤维的纵剖面上形成较大的压缩位移。
当碳纤维的受力面与纤维轴向的夹角处于0°和90°之间时,所受的压缩载荷可以分解为平行和垂直于纤维轴向的两个方向的载荷。随着受力面与纤维轴向夹角的增大,纳米压痕的压头与碳纤维石墨微晶中石墨烯片层的楔形效应减弱,石墨微晶边界处的折裂现象增加,相应地,在相同压痕位移下,压缩载荷逐渐增加[25, 29-30]。
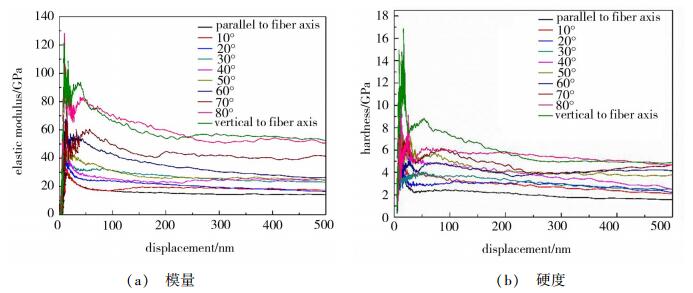
2.3 碳纤维模量-位移和硬度-位移曲线图 6为碳纤维的模量和硬度与位移的曲线。在压入位移为100 nm之前,实验获得的纤维不同取向的弹性模量和硬度波动较大,这主要是由两方面原因造成的:(1) 试样表面为物理表面,存在一定的粗糙度;(2) 纤维不同取向的试样均采用机械抛光,存在一定厚度的表面硬化层,其厚度约100 nm。压入位移超过100 nm后,实验获得的数据比较稳定,对于不同取向的碳纤维,其弹性模量和硬度随位移增加而趋于平缓。因此,取100~500 nm数据的平均值作为每次测试的模量和硬度,并计算纤维不同取向的弹性模量和硬度的平均值和标准偏差,其结果如图 6所示。文献[31-34]中有关碳纤维横向模量的报道值变化较大,对于PAN碳纤维,其弹性模量分布在10~60 GPa,纵向弹性模量主要分布在6~20 GPa。

|
| 图 6 碳纤维纳米压痕的模量和硬度与位移的曲线 Figure 6 Modulus-depth curves and hardness-depth curves of T800SC carbon fiber under nanoindentation test |
从图 7中可以看出,随着测试面与纤维轴向夹角的增大,T800SC碳纤维不同取向的弹性模量和硬度逐渐增大。T800SC碳纤维的弹性模量从平行纤维轴向时的(15.84±2.00) GPa增加到垂直纤维轴向时的(50.96±5.73) GPa;T800SC碳纤维的硬度从平行纤维轴向时的(2.71±0.51) GPa增加到垂直纤维轴向时的(5.24±0.91) GPa。对于T800SC碳纤维的模量测试,测试面与纤维轴向夹角超过50°后,模量快速增加,表明在此阶段后,在压缩载荷作用下,碳纤维内石墨微晶处的折裂现象逐渐占主导作用。对于碳纤维不同取向的硬度,硬度虽随着测试面与纤维轴向夹角的增加而增加,但是增加趋势较缓。

|
| 图 7 T800SC碳纤维弹性模量和硬度随纳米压痕测试角度的变化 Figure 7 Variation of the elastic modulus and hardness of T800SC carbon fiber with nanoindentation test angle |
图 8为碳纤维不同取向的弹性模量和硬度的Weibull分布曲线。对于纤维不同取向的弹性模量,其Weibull模数变化较小(9.0~10.5);对于纤维不同取向的硬度,其Weibull模数在6.0~8.0。相对于弹性模量,碳纤维的硬度的Weibull模数分散性较大,这主要归结于纳米压痕硬度的定义和计算方式。纳米压痕硬度反应样品承受接触载荷的能力。因为碳纤维内部分布着众多纳米尺度的孔隙。由于孔隙的存在,在压缩载荷作用下,不同纤维的不同测试区域承受载荷的能力差异性较大,所以测试结果分散性较大,Weibull模数较小。

|
| 图 8 T800SC碳纤维不同测试角度弹性模量和硬度的Weibull分布曲线 Figure 8 Weibull plots for calculating elastic modulus and hardness under different test angle |
总体来看,T800SC碳纤维不同取向的弹性模量和硬度的Weibull模数均超过5,表明其性能均匀性较好[35]。由最小二乘法获得T800SC碳纤维不同取向的弹性模量和硬度的Weibull模数如表 2所示。T800SC碳纤维不同取向的弹性模量和硬度的特征值与弹性模量和硬度的平均值接近,并略大于平均值。对比碳纤维不同取向的弹性模量和硬度的变异系数及Weibull模数,两者均能描述碳纤维性能的离散程度,但是在预测碳纤维的失效概率方面,Weibull模数的作用更加突出[36]。
| θ/(°) | Eaverage/GPa | Ech/GPa | m | Haverage/GPa | Hch/GPa | m |
| 0 | 15.84 | 16.69 | 9.62 | 2.71 | 2.92 | 6.18 |
| 10 | 17.39 | 18.12 | 10.24 | 2.87 | 3.10 | 6.16 |
| 20 | 18.21 | 19.27 | 10.11 | 2.97 | 3.29 | 7.70 |
| 30 | 23.92 | 25.40 | 9.40 | 3.44 | 3.70 | 6.42 |
| 40 | 27.74 | 29.15 | 9.90 | 4.26 | 4.57 | 6.97 |
| 50 | 28.03 | 29.50 | 9.66 | 4.27 | 4.59 | 6.27 |
| 60 | 35.96 | 37.90 | 9.03 | 4.37 | 4.65 | 7.87 |
| 70 | 40.04 | 42.15 | 9.78 | 4.47 | 4.98 | 6.88 |
| 80 | 48.17 | 51.15 | 9.36 | 4.65 | 5.61 | 6.71 |
| 90 | 50.96 | 53.24 | 9.94 | 5.24 | 5.90 | 6.80 |
(1) 随着测试面与纤维轴向夹角的增大,T800SC碳纤维不同取向的弹性模量和硬度逐渐增大。
(2) T800SC碳纤维的弹性模量从平行纤维轴向时的(15.84±2.00) GPa增加到垂直纤维轴向时的(50.96±5.73) GPa;其硬度从平行纤维轴向时的(2.71±0.51) GPa增加到垂直纤维轴向时的(5.24±0.91) GPa。
(3) 对于纤维不同取向的弹性模量,其Weibull模数在9.0~10.5;对于纤维不同取向的硬度,其Weibull模数在6.0~8.0。T800SC碳纤维不同取向的弹性模量和硬度的Weibull模数均超过5,定量表明其性能均匀性较好。
(4) 碳纤维横截面在受压缩载荷作用时,纤维内的石墨微晶中石墨烯片层的剪切和折裂,需施加较大的压缩载荷才能在碳纤维的石墨微晶边界处产生折裂变形;碳纤维纵剖面在受压缩载荷作用时,石墨烯片层之间结合力较弱,在纳米压头压缩载荷作用下,石墨烯片层之间趋于彼此分离(楔形效应),较小的压缩载荷即可在碳纤维的纵剖面上形成较大的压缩位移。
(5) 当碳纤维的受力面与纤维轴向的夹角处于0°和90°之间时,随着受力面与纤维轴向夹角的增大,纳米压痕的压头与碳纤维石墨微晶中石墨烯片层的楔形效应减弱,石墨微晶边界处的折裂现象增加。
| [1] | UMEMURA S, ANDOH Y, HIRONO S, et al. Nanoindentation and nanowear tests on amorphous carbon films[J]. Philosophical Magazine A, 1996, 74(5): 1143–1157. |
| Click to display the text | |
| [2] | FIELD S, SWAIN M V. The indentation characterization of the mechanical properties of various carbon materials:glassy carbon, coke and pyrolytic carbon[J]. Carbon, 1996, 34(11): 1357–1366. |
| Click to display the text | |
| [3] | KANARI M, TANAKA K, BABA S, et al. Nanoindentation behavior of a two-dimensional carbon-carbon composite for nuclear applications[J]. Carbon, 1997, 35(10): 1429–1437. |
| Click to display the text | |
| [4] | RICHTER A, RIES R, SMITH R, et al. Nanoindentation of diamond, graphite and fullerene films[J]. Diamondand Related Materials, 2000, 9(2): 170–184. |
| Click to display the text | |
| [5] | HAO M Y, LUO R Y, XIANG Q, et al. Effects of fiber type on the microstructure and mechanical properties of carbon/carbon composites[J]. New Carbon Material, 2014, 29(6): 444–453. |
| Click to display the text | |
| [6] | SARKAR S, DEY A, DAS P K, et al. Evaluation of micromechanical properties of carbon/carbon and carbon/carbon-silicon carbide composites at ultralow load[J]. Internation Journal of Appied Ceramic Technology, 2011, 8(2): 282–297. |
| Click to display the text | |
| [7] | MARX D T, RIESTER L. Mechanical properties of carbon-carbon composite components determined using nanoindentation[J]. Carbon, 1999, 37(11): 1679–1684. |
| Click to display the text | |
| [8] | OZCAN S, TEZCAN J, FILIP P. Microstructure and elastic properties of individual components of C/C composites[J]. Carbon, 2009, 47(15): 3403–3414. |
| Click to display the text | |
| [9] | DISS P, LAMON J, CARPENTIER L, et al. Sharp indentation behavior of carbon/carbon composites and varieties of carbon[J]. Carbon, 2002, 40(14): 2567–2579. |
| Click to display the text | |
| [10] | 谭婷婷. 高性能PAN基碳纤维微观结构与力学性能相关性研究[D]. 山东大学, 2013: 20-26. |
| Cited By in Cnki | |
| [11] | 陈丽. 碳纤维微观结构表征与性能分析[D]. 西南科技大学, 2015: 23-30. |
| Cited By in Cnki | |
| [12] |
井敏, 谭婷婷, 王成国, 等. PAN基碳纤维的微观结构与力学性能相关性分析[J].
航空材料学报, 2013, 33(1): 78–85.
|
| Cited By in Cnki (19) | |
| [13] |
井敏, 谭婷婷, 王成国, 等. 东丽T800H与T800S碳纤维的微观结构比较[J].
材料科学与工艺, 2015, 23(2): 45–52.
|
| Cited By in Cnki (5) | |
| [14] |
井敏, 谭婷婷, 王成国, 等. 3种高强中模型PAN基碳纤维的微观结构比较[J].
功能材料, 2014, 45(8): 08028–08032.
|
| Cited By in Cnki (2) | |
| [15] |
张新, 马雷, 李常清, 等. PAN基他纤维微观结构特征的研究[J].
北京化工大学学报, 2008, 35(5): 57–60.
|
| Cited By in Cnki (2) | |
| [16] | 赵洪江. PAN原丝取向与碳纤维模量的相关性研究[D]. 北京化学大学, 2015: 26-32. |
| Cited By in Cnki | |
| [17] | 胡胜泊. 碳纤维结构与性能关系的电子显微镜研究[D]. 北京化工大学, 2008: 20-30. |
| Cited By in Cnki | |
| [18] | OLIVER W C, PHARR G M. An improved technique for determining hardness and elastic modulus using load and displacement sensing indentation experiments[J]. Journal of Materials Research, 1992, 7(6): 564–1583. |
| Click to display the text | |
| [19] | HUSON M G, CHURCH J S, KAFI A A, et al. Heterogeneity of carbon fiber[J]. Carbon, 2014, 68: 240–249. |
| Click to display the text | |
| [20] | CRAWFORD D, JOHNSON D J. High resolution electron microscopy of high modulus carbon fibers[J]. Journal of Microscopy, 1971, 94(1): 51–62. |
| Click to display the text | |
| [21] | HUANG Y, YOUNG R J. Effect of fiber microstructure upon the modulus of PAN-and pitch-based carbon fibers[J]. Carbon, 1995, 33(2): 97–107. |
| Click to display the text | |
| [22] | CHAE H G, NEWCOMB B, GULGUNJE P, et al. High strength and high modulus carbon fibers[J]. Carbon, 2015, 93: 81–87. |
| Click to display the text | |
| [23] | ZHOU Gengheng, LIU Yequn, HE Lianlong, et al. Microstructure difference between core and skin of T700 carbon fibers in heat-treated carbon/carbon composites[J]. Carbon, 2011, 49(9): 2883–2892. |
| Click to display the text | |
| [24] | GUIGON M, OBERLIN A, DESARMOT G. Microtexture and structure of some high modulus, PAN-based carbon fibers[J]. Fiber science and technology, 1984, 20(3): 177–198. |
| Click to display the text | |
| [25] | GROSS T S, TIMOSHCHUK N, TSUKROV I I, et al. On the ability of nanoindentation to measure anisotropic elastic constants of pyrolytic carbon[J]. Journal of Applied mathematics and Mechanics, 2013, 93(5): 301–312. |
| Click to display the text | |
| [26] | BARSOUM M W, MURUGAIAH A, KALIDINDI S R, et al. Kink bands, nonlinear elasticity and nanoindentations in graphite[J]. Carbon, 2004, 42(8/9): 1435–1445. |
| Click to display the text | |
| [27] | GROSS T S, TIMOSHCHUK N, TSUKROV I, et al. Unique nanoindentation damage for highly textured pyrolytic carbon[J]. Carbon, 2013, 60: 273–279. |
| Click to display the text | |
| [28] | OZCAN S, TEZCAN J, FILIP P. Microstructure and elastic properties of individual components of C/C composites[J]. Carbon, 2009, 47(15): 3403–3414. |
| Click to display the text | |
| [29] | GEBERT J M, REZNIK B, PIAT R, et al. Elastic constants of high texture pyrolytic carbon measured by ultrasound phase spectroscopy[J]. Carbon, 2010, 48(12): 3635–3658. |
| Click to display the text | |
| [30] | GUELLALI M, OBERACKER R, HOFFMAN M J. Influence of heat treatment on microstructure and properties of highly textured pyrocarbons deposited during CVD at about 1100°C and above 2000°C[J]. Composites science and technology, 2008, 68(5): 1122–1130. |
| Click to display the text | |
| [31] | SARKAR S, DEY A, DAS P K, et al. Evaluation of micromechanical properties of carbon/carbon and carbon/carbon-silicon carbide composites at ultralow load[J]. Internation Journal of Appied Ceramic Technology, 2011, 8(2): 282–297. |
| Click to display the text | |
| [32] | DISS P, LAMON J, CARPENTIER L, et al. Sharp indentation behavior of carbon/carbon composites and varieties of carbon[J]. Carbon, 2002, 40(14): 2567–2579. |
| Click to display the text | |
| [33] | FUJITA K, SAWADA Y, NAKANISHI Y. Effect of cross-sectional textures on transverse compressive properties of pitch-based carbon fibers[J]. Materials Science Research International, 2011, 7(2): 116–121. |
| Click to display the text | |
| [34] | WEI Liming, ZHANG Yue, XU Chenghai, et al. Mechanical properties of 3D carbon/carbon composites by nanoindentation technique[J]. Journal of Central South University, 2012, 19(1): 36–40. |
| Click to display the text | |
| [35] |
龚江宏, 关振铎. 一种确定陶瓷材料Weibull模数的简便方法[J].
硅酸盐学报, 1998, 26(1): 81–86.
|
| Cited By in Cnki (11) | |
| [36] | ANTON N, VELASCO F, GORDO E, et al. Statistical approach to mechanical behavior of ceramic matrix composites based on Portland clinker[J]. Ceramics International, 2001, 27(4): 391–399. |
| Click to display the text |


